(Note: at time of this post, both Field parameters and New card visual are still in preview. To use these two functions, go to File –> Options and settings –> Options –> Previw features, and turn on these features.)
You might need to develop Power BI KPI report for different department/user with same visual format but different data. For example, a report with some card visual and line chart for different but targeting different KPI measures. We can develope different report for different department/user for their specific KPI measures. However, we can using Field Parameter together with other technics to develop one dynamic KPI report that displaying the desired visual based on the user login.
First, create a KPIs field parameter (Modeling –> New parameter –> Fields), add all the required measure for the report into this KPIs parameter. A KPIs table will be created.
Modify the KPIs table query and add a new column (by add a new value to each row), and rename the new column as KPI-Group-ID:
KPIs = {
    ("Sales Total", NAMEOF('Metrics'[Sales Total]), 0, 1),
    ("Cost Total", NAMEOF('Metrics'[Cost Total]), 1, 1),
    ("Discount Total", NAMEOF('Metrics'[Discount Total]), 2, 1),

    ("Margin pct", NAMEOF('Metrics'[Margin pct]), 3, 2),
    ("Margin Total", NAMEOF('Metrics'[Margin Total]), 4, 2),
    ("Price Avg", NAMEOF('Metrics'[Price Avg]), 5, 2)
}
In above code example, Sales Total/Cost Total/Discount Total have been assigned to KPI-Group-ID 1, where as Margin pct/Margin Total/Price Avg have been assigned to KPI-Grou-ID 2.
Create a new table KPI-RBAC to control role level security. In this example, we use KPI-RBAC to control which email address has access to with KPI-Group-ID.
In KPIs table, create a new measure KPI Filter:
KPI Filter =
VAR _User = SELECTEDVALUE('KPI-RBAC'[EmailAddress]) //USERPRINCIPALNAME()  --when publich to PowerBI service, we will use USERPRINCIPALNAME() to retrive current user's actual email address.
VAR _KPI_Group_ID_Selected =
    CALCULATE(
        MAX('KPI-RBAC'[KPI-Group-ID]),
        'KPI-RBAC'[EmailAddress] = _User
    )
VAR _KPI_Filter =
IF(SELECTEDVALUE(KPIs[KPI-Group-ID]) = _KPI_Group_ID_Selected,
    1,
    0
)
RETURN
   _KPI_Filter
Add a Card (new) visual, (note: not Card visual), onto the report and drag the KPIs onto the visual. Add a linechart visual and drag the KPIs onto the visual.
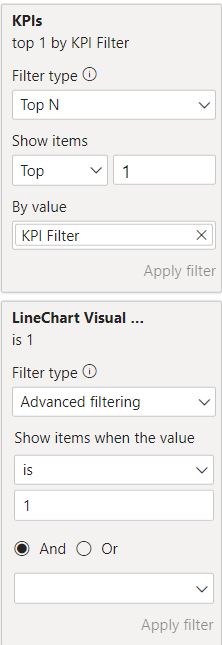
Add KPIs as filter for the visuals. We will define the filter as “top 1 by KPI Filter”.
If not card visual and linechart visual not include the same measures, we can add another column onto KPIs table with values 0 (invisable) or 1 (visable), and rename it as, say, “LineChart Visual Enabled”.
KPIs = {
    ("Sales Total", NAMEOF('Metrics'[Sales Total]), 0, 1, 1),
    ("Cost Total", NAMEOF('Metrics'[Cost Total]), 1, 1, 1),
    ("Discount Total", NAMEOF('Metrics'[Discount Total]), 2, 1, 0),

    ("Margin pct", NAMEOF('Metrics'[Margin pct]), 3, 2, 1),
    ("Margin Total", NAMEOF('Metrics'[Margin Total]), 4, 2, 0),
    ("Price Avg", NAMEOF('Metrics'[Price Avg]), 5, 2, 0)
}
Add “LineChart Visual Enabled” as filter for the linechart visual and define the filter as “Show items when the value is 1”.
Watch Automatically select KPIs based on the USER | Mastering UX in Power BI Report Design by Bas from datatraining.io