When developing Power BI report with date slicer, the large date range might make the visual overwhelming if the X axis interval is on a fix date/week/month/quater interval. It would be helpful if the X axis can auto adjust the interval betwee date/week/month/quater/year. Assumed you have a date table dimDate in your report. We can add another AutoPeriod table (in Model View –> click on New table) to define the possible intervals for the axis:
AutoPeriod = {
    ("Date", NAMEOF('dimDate'[Date]), 0),
    ("Week", NAMEOF('dimDate'[Week]), 1),
    ("Month", NAMEOF('dimDate'[Month]), 2),
    ("Quarter", NAMEOF('dimDate'[Quarter]), 3),
    ("Year", NAMEOF('dimDate'[Year]), 4)
}
Create a measures table to hold common measures (Home –> Enter data –> specify a table name, such as Matrics –> click Load. You can remove the default column1 after add your measure.). Add a new measure XAxisInterval to this new measures table:
XAxisInterval =
VAR _MonthCount = COUNT(dimDate[Date])/30   --calculate proximate number of months in the selected date range
VAR _AutoPeriod = IF(ISBLANK(SELECTEDVALUE('AutoPeriod'[AutoPeriod Order])),0,SELECTEDVALUE('AutoPeriod'[AutoPeriod Order]))
RETURN
SWITCH(
    TRUE,
    _MonthCount <= 1 && _AutoPeriod = 0, 1, --if less than 1month, display by date
    _MonthCount > 1 && _MonthCount <= 3 && _AutoPeriod = 1, 1,  --if less than 3months, display by week
    _MonthCount > 3 && _MonthCount <= 6 && _AutoPeriod = 2, 1,  --if less than 6months, display by month
    _MonthCount > 6 && _MonthCount <= 24 && _AutoPeriod = 3, 1, --if less than 24months, display by quater
    _MonthCount > 24 && _AutoPeriod = 4, 1, --if more than 24months, display by year
    0   --default display by date
    )
Add a visual filter for AutoPeriod, top 1 by XAxisInterval:
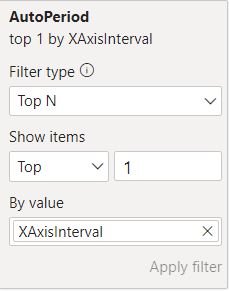
Now, when you change the date slicer range, the XAxis will auto adjust it’s interval based on selected range.
Following the same concept, we can have the visual title to be dynamically reflecting to the axis. Create a measure Chart Title:
Chart Title =
VAR _MonthCount = MAX(AutoPeriod[AutoPeriod Order])
RETURN
SWITCH(
    TRUE,
     _MonthCount = 0, "Sales by day",
     _MonthCount = 1, "Sales by week",
     _MonthCount = 2, "Sales by month",
     _MonthCount = 3, "Sales by quarter",
     _MonthCount = 4, "Sales by year"
 )
Then change the visual title to use this Chart Title, under Format Visual –> General –> Title –> Text. Now the visual title will auto adjust when axis interval changed.
Watch SMART AXIS Magic | Let Power BI Choose the OPTIMAL Period by Bas from datatraining.io